Comparision Of A New 3D Automated Volume Calculation Technique (SONO AVC) With Conventional 2D Manual Follicular Tracking In In-Vitro Fertilization (IVF) Cycles; A Prospective Study
Dr. Usha B R.
PURPOSE – To compare the predictive value of manual follicle monitoring v/s the use of Sono AVC, a new software in routine follicle monitoring in IVF practice.
METHODS – This is a prospective study done at the ART centre. Sono AVC (automated volume calculation) is a new 3-D ultrasound software which allows for a more objective and reproducible assessment of follicle. A total of forty six patients undergoing in-vitro fertilisation at our ART centre were recruited. Follicle monitoring was done both manually in 2-D and with the use of 3-D Sono-AVC. Both the techniques were performed in same patients by a single trained observer with Voluson S6 and 4-D transvaginal probe. The follicle count and dimensions were noted using 2-D and the 3-D technique on the day of oocyte retrieval and compared with the number of oocytes retrieved.
RESULTS – A total of 46 patients were studied i.e. a total of 91 ovaries were studied, as there was one patient with an absent ovary. Mean duration of time taken for manual and Sono AVC are 209.2s and 156.6s respectively (p-0.01). Manual count of total number of follicles in comparison to Sono AVC total count of follicles>10mm was found to be lesser with a mean of difference of -1.45 and was found to be statistically significant. Leading follicle diameter measured manually is in agreement with volume based diameter d(V) as well as mean diameter measured on Sono AVC but correlates better with d(V)(mean of difference -0.09).
CONCLUSION – 3-D Sono AVC is a useful adjunct in routine follicle monitoring, with significant reduction in time and correlates well with manual counts.It is a very good tool to counsel patients regarding ovarian response as it is pictorial and also serves to maintain graphical record of each cycle which could serve as a guide in the future if need arises. Further research with larger sample size is required to further validate our study. Keywords- Sono AVC, follicle monitoring, 3-D ultrasound.
INTRODUCTION With the rising trend in infertility, the number of patients being referred for ART centres is also on the rise. Ultrasound follicle monitoring is an integral part of any ART cycle. After recruitment of a patient in a cycle follicular scans begin on day 1 and continues after day 5/6 every alternate day depending on the follicular response. With this frequent monitoring, there is a requirement of a method of follicle tracking which is more objective or reproducible and could also lessen the time taken for busy practitioners.
SONO AVC (Sonography based Automated Volume Calculation) is a new software introduced by GE company in its VOLUSON machine. This software is based on the inversion mode principle, takes a 3-D sweep of the entire ovary, makes automated volume based calculations and gives results within seconds. The inversion mode allows the cystic areas or follicles in the ovary to appear uniformly echogenic in its entirety and the background grey areas to appear transparent.
MATERIALS AND METHODS
This was a prospective study done at our ART centre. A total of 46 patients were recruited for in-vitro fertilisation cycles enrolled. Follicular monitoring was done with GE Voluson S6 pro machine with a 4-D transvaginal probe. Follicular measurements were made manually in 2-D plane taking into account the average of breadth and length of the follicle. Following this, 3-D Sono AVC was also applied to note the leading follicle diameter. All decisions to increase or reduce the dose of gonadotropins and the ovulation trigger were based on the manual measurements. On the day of oocyte retrieval, just prior to the procedure, total number of follicles was counted manually and manual measurement of average diameter of all follicles more than 10mm was done and time required for the same noted. After this 3-D Sono AVC was applied to take a sweep of the complete ovary. Volume analysis is selected and the area of interest, that is the ovary alone, is selected.
Sono AVC makes automated calculations. It calculates largest diameters in three orthogonal planes and gives an average of these three which is the mean diameter (mn.d) of the follicle. It also calculates volume(V) based on this diameter. It creates a perfect sphere of this volume and then calculates the diameter which is mentioned in the chart as volume based diameter(d(V)).Sometimes there may be compression of follicles especially in ovaries where there is over-crowding of follicles. This causes follicle to get elongated in one of the diameters giving false values. The concept of volume based diameter eliminates this error as it creates diameter of the follicle if it were not to be compressed.
Sono AVC gives a chart where it lists volume based diameter, the diameters in the three orthogonal planes as dx, dy and dz , the mean diameter (mn.d) and the volume (V) of each follicle. Once the list of follicles is obtained, we need to scroll through the ovary to see if all the follicles and only the follicles have been included. Sometimes, erroneously a nearby vessel or hydrosalpinx could be picked as a follicle which needs to be removed or many a times a big follicle may not be picked if the prior 2-D image is not good in which case it needs to be added. A 3-D view of the ovary can be obtained on cine calculation where the entire ovary can be rotated upto 3600 to view the follicles which are presented in different colours. Sono AVC also gives a follicle tracking chart from day 1 of stimulation. This chart could be made either based on measurements of mean diameter or volume based diameter or volume of each follicle.
In our study each ovary was observed as a different subject we have done 4 important comparisons. First, the total number of follicles (total count) measured manually v/s total number of follicles seen in Sono AVC chart of >10mm. We have taken this 10 mm as cut off to compare with the oocyte retrieval as follicles <10mm do not fetch an oocyte. Second, the leading follicle diameter measured manually was compared with the mean diameter and volume based diameter obtained on 3-D Sono AVC. Third, we have compared total count measured manually and 3-D Sono AVC with the number of oocytes retrieved. Fourth, the total time taken for measuring all the follicles manually and time taken for 3-D Sono AVC including the post-processing is noted and compared.
STATISTICAL METHODS
For agreement analysis, the difference between two parameters and mean of the two parameters were computed. The mean of differences and its 95% confidence intervals were calculated. Kendall’s tau-b coefficient between difference and mean were compiled. Measurement error (Standard deviation of differences/√2) was calculated and Error range was computed as measurement error × 1.96 (critical value).
Finally, intra- class correlation co-efficient was computed between the 2 parameters. Bi-variant correlation coefficient was computed between manual count and number of oocytes retrieved. Similarly, Bi-variant correlation co-efficient was computed between Sono AVC count and number of oocytes retrieved. For all statistical tests, p<0.05 was considered significant.
RESULTS
A total of 46 patients and a total of 91 ovaries were studied, as there was one patient with single ovary. Mean duration of time with manual and SONO AVC are 209.2s and 156.6s respectively (p-0.01).
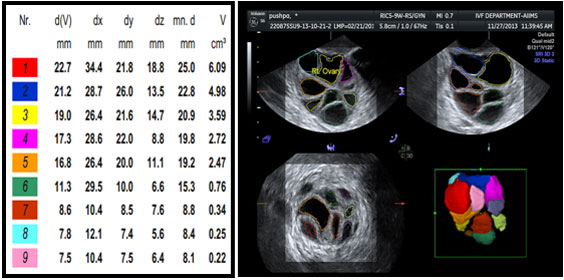
Fig-1 Sono AVC report
| Mean of differences | 95% C.I. | Kendall’s tau b coefficient | Error range | Intra class correlation | |
| Total count of follicles(manual v/s 3-D) | -1.45 | -1.94 to -0.95 | -0.39 (p=0.00) | 3.25 | 0.906 |
| Leading follicle diameter(manual v/s 3-D mn.d) | -1.70 | -2.2 to -1.20 | -0.06 (p=0.40) | 3.31 | 0.708 |
| Leading follicle (manual v/s 3-d(V)) | -0.09 | -0.46 to -0.27 | 0.083 (p=0.24) | 2.43 | 0.829 |
Table-1
Manual count of total number of follicles in comparison to Sono AVC total count of follicles>10mm was found to be lesser with a mean of difference of -1.45 and was found to be statistically significant. This simply means Sono AVC picks up more number of follicles. Most of our decision making in IVF cycles is based on leading follicle diameter. Leading follicle diameter measured manually is in agreement with volume based diameter d(V) as well as mean diameter measured on Sono AVC but correlates better with d(V)(mean of difference -0.09).
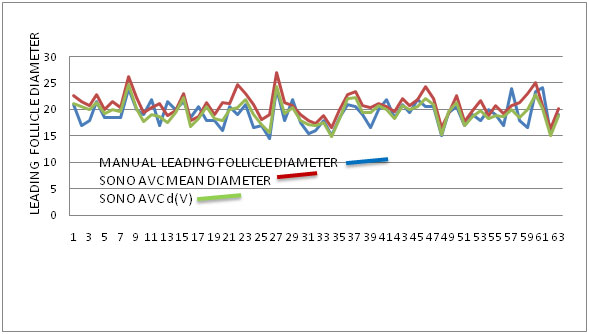
Fig –2 showing the good correlation between manual leading follicle diameter and Sono AVC values.
| PEARSON CORRELATION (r) | P-VALUE | |
| Manual count and oocyte retrieval | 0.729 | <0.001 |
| 3-D Sono AVC count and oocyte retrieval | 0.688 | <0.001 |
Table -2
The above table explains that both manual count and Sono AVC count of total number of follicles correlate well with the number of oocytes retrieved.
DISCUSSION
Sono AVC software definitely seems promising as a present and future of follicle tracking. There are many advantages with this technique. It saves on time for the busy practitioners. It is more objective and reproducible compared to manual measurements. It requires only a little bit of training to master the technique. It would be easier for senior consultants to ask the juniors or residents to do follicle tracking with this software. Subjective errors during measurement of follicle like re-measuring the same follicle or missing out on a follicle as it may be bigger in a different plane can be reduced with the 3-D technique.It provides a graphical record of the ovarian response which can be stored for follow-up in next IVF cycles. It is pictorial providing a colourful picture of the ovary representing follicles with different colours and it would be easy to counsel the patients with pictures. Patients can be told about the numbers of follicles either poorly responding or hyper responding so that they know as to what to expect from that cycle prior to the oocyte retrieval.Sono AVC can also be used to measure antral follicle count. In pregnancy, studies have reported the use of Sono AVC for the measurement of gestational sac volume, embryo volume, fetal stomach volume, fetal cardiac ventricle volume and neuro sonoembyology.1
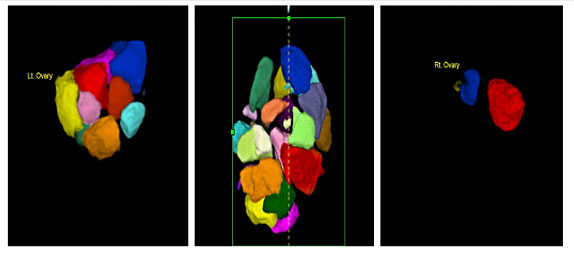
Fig –3 Ovarian response shown as Normal, Hyper response and Poor response.
Sono AVC software is not completely fool proof as it has pitfalls. There are two important things to get a good report. One is prior to taking a 3-D sweep we need to ensure that the image obtained in 2-D plane is crisp with margins of follicles being clearly defined.Second, after taking a 3-D sweep, we need to select the area of interest i.e. the ovary completely in all three orthogonal planes. Sono AVC for follicle monitoring requires minimal post processing if a good 2-D image is obtained. If a good 2-D image is not obtained, then the procedure requires post processing, which makes it semi-automated. Post processing involves scrolling through the entire ovary to see if all the follicles have been included. Sometimes erroneously adjacent blood vessel, cyst, encysted collection is also picked up as follicle.So we need to do post- processing to add or remove follicles, cut or merge follicles or adjust the settings of growth or separation of two follicles. This consumes a bit of the time with Sono AVC, which otherwise provides results within seconds.The other most important disadvantage is the cost of the machine which would add on to the burden of the ART centre.
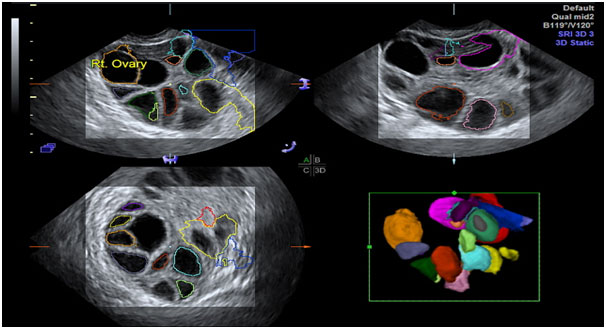
Fig- 4 showing pitfalls of Sono AVC requiring post-processing
Baris Ata et al reported a study of 100 women undergoing in-vitro fertilisation.Each follicle was measured manually as well as with the use of Sono-AVC. Both SonoAVC-generated mean follicle diameter, volume based diameter, follicle counts, as well as the leading follicle diameter had good agreement with conventional 2D US measurements. SonoAVC measurements had very good reproducibility, with intra-class correlation coefficient ≥0.8 for most evaluations.2
N.Raine-Fenning et al report a study of Sono AVC in 51 women undergoing in-vitro fertilisation. They made volume estimations of 224 follicles using Sono-AVC, VOCAL AND manually and measured the follicular aspirate volume during oocyte retrieval. Sono AVC provided highly accurate measurements in comparison to VOCAL and manual measurements.3The same group also report another prospective study of 89 subjects undergoing in-vitro fertilisation. The number of follicles and the mean diameter of follicles were measured both manually and with Sono AVC.There was no significant difference in the number of follicles with mean diameters >9 mm, >13 mm and >17 mm measured by either method. The total time taken for follicular measurements was significantly less (P < 0.01) for the automated 3D method (180.5 ± 63.6 versus 236.1 ± 57.1 s) which was associated with significantly less exposure to ultrasound (39.0 ± 6.0 versus 236.10 ± 57.1 s; P < 0.001).4
CONCLUSION
3-D Sono AVC is a useful adjunct in routine follicle monitoring, with significant reduction in time and correlates well with manual counts. Leading follicle diameter measured manually is in agreement with volume based diameter d(V) as well as mean diameter measured on Sono AVC but more so with d(V).It is a very good tool to counsel patients regarding ovarian response as it is pictorial and also serves to maintain graphical record of each cycle. Further research with larger sample size is required to further validate our study.
REFERENCES
1.Baris Ata, Togas Tulandi . Ultrasound automated volume calculation in reproduction and in pregnancy. Fertility and Sterility Vol. 95, No. 7, June 2011.
2.Baris Ata, Ayse Seyhan . Comparison of automated and manual follicle monitoring in an unrestricted population of 100 women undergoing controlled ovarian stimulation for IVF. Human Reproduction, Vol.0, No.0 pp. 1–7, 2010.
3.N. Raine-Fenning, K. Jayaprakasan . SonoAVC: a novel method of automatic volume calculation. Ultrasound Obstet Gynecol 2008; 31: 691–696.
4.N Raine-Fenning, K Jayaprakasan . Automated follicle tracking improves measurement reliability in patients undergoing ovarian stimulation. Reproductive BioMedicine Online Volume 18, Issue 5, 2009, Pages 658–663.
5.Juan Luis Alcazar.The Use of Three dimensional Ultrasound in Gynecological patients. Donald School Journal of ultrasound in Obstetrics and Gynaecology. October- December 2008 ; 2(4) :10-16.
6.Sonal Panchal, Chaitanya Nagori. Comparison of anti-mullerian hormone and antral follicle count for assessment of ovarian reserve. J Hum Reprod Sci. 2012 Sep-Dec; 5(3): 274–278.